You Built It. Now Make Sure They Come: SharePoint Site Usage Analytics
Microsoft 365 SharePoint data sprawl is common across construction organizations, especially if project teams are given carte blanche permission to create their own sites. Fortunately, Microsoft has provided SharePoint site analytics to gain insight into whether sites are being used. Check out this article to see how SharePoint site analytics works and how the reports might help your organization get the most out of SharePoint.
A significant pro and con of SharePoint is how straightforward and quick it is to create sites. Because of this, IT departments often grant SharePoint admin permissions to project teams to add and develop sites on their own, often without guidance. Before you know it, hundreds of sites are loose in the wild. And once the genie is out of the bottle, it is challenging for IT departments to control the ensuing data sprawl.
How to Get SharePoint Site Usage Reports
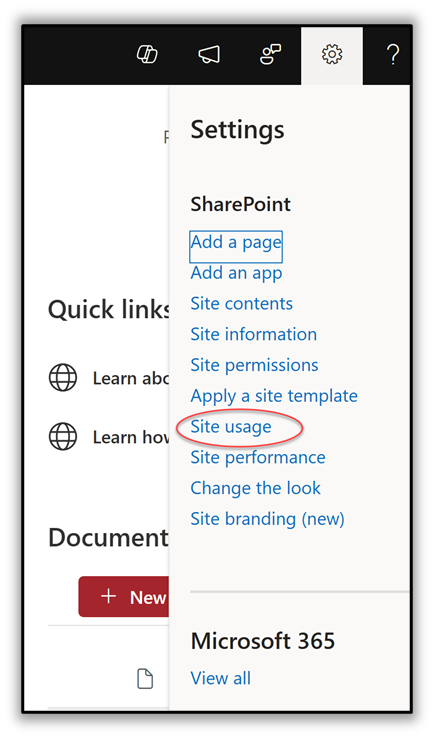
To help get the most out of SharePoint and possibly reduce the number of sites, Microsoft includes site usage reports to understand how the sites are being used. You can access the reporting from the site settings by clicking Site Usage.
Note the following considerations:
- Site admins, owners, members, and visitors can view site usage data.
- Site visitors cannot run external user reports or download the 90-day usage report.
- Guest users with Site Owner permissions will not have access to site analytics or site usage data.
Available SharePoint Site Usage Report Dashboards
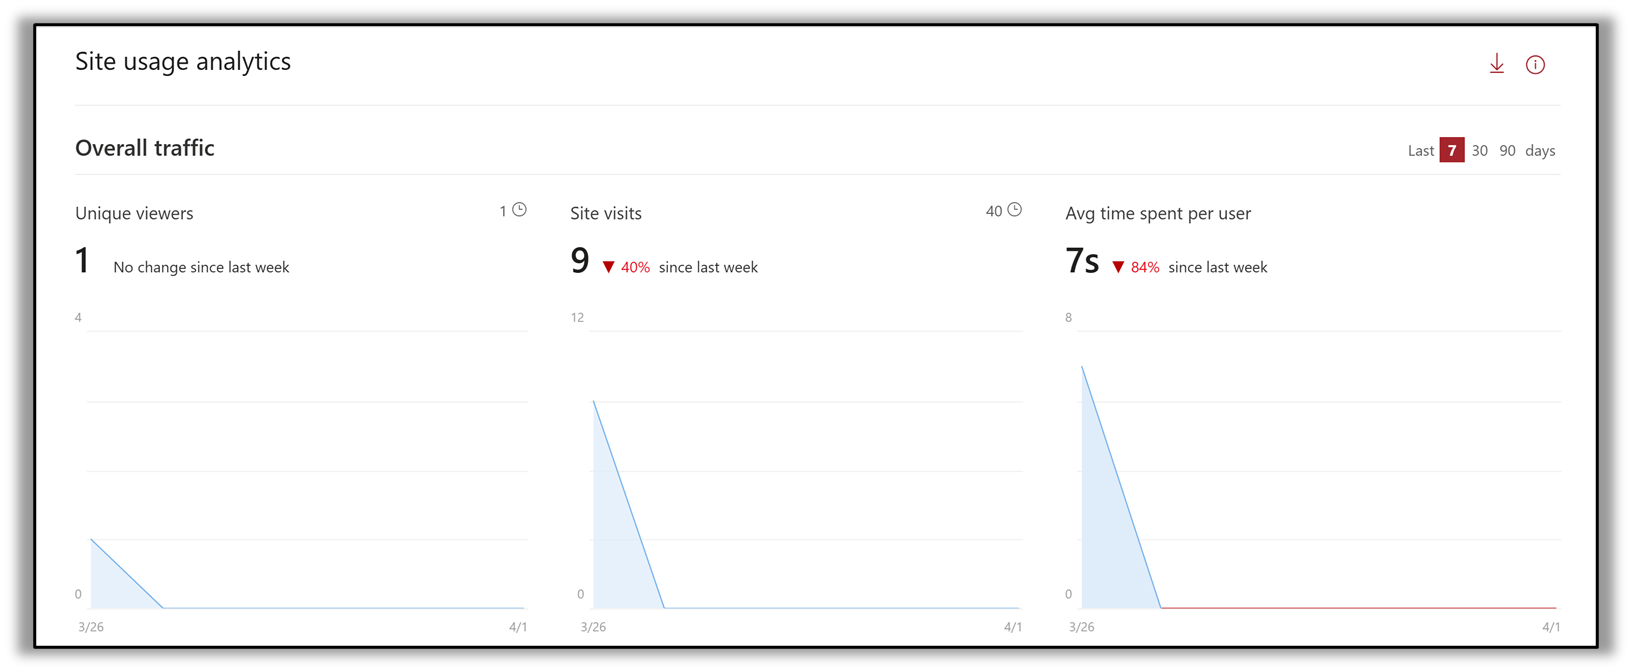
There are many valuable dashboards available in the site usage reports that provide 7, 30, and 90-day windows of site usage data.
Overall Traffic
Unique viewers
This dashboard provides the number of unique viewers of your site regardless of how often they visit it. So, if you want to see if the entire project team has at least accessed a site, this report will be beneficial.
Site visits
Site visits provide the total number of visits to pages, documents, and news. This dashboard lets you see how often users visit the site. If they haven't visited the site for over 90 days and the project is closed, it might be a good candidate for deletion or archiving.
Average time spent per user
The average time spent per user report shows the trend of actual time spent on modern SharePoint site pages and news posts by users. The report calculates when users are active on the page or news post, not counting when the page is minimized or when the user has the page open but is inactive.
This report might provide insight into whether the site is compelling enough to keep users engaged. If there are many viewers but they don't spend much time on the site, it might warrant a redesign of the site for more interactivity or rethink what type of content is provided.
Popular content in the last 7 days.
These dashboards provide insights into the number of unique viewers, visits, and time spent across Site Pages, News, and Documents.
Note the following considerations:
- Guest and anonymous views and visits are included for sites after March 2019.
- User activity reflected in the report will not include usage data collected in the last 60 minutes.
- When a third-party tool is used to render PDF files from a SharePoint Online library, these views are not recorded, nor are they reflected in the file view statistics in the audit log.
- Files such as .jpg, .gif, .jpeg, .png, and .svg are excluded from the reports.
Usage insights
Usage insights are a more granular view of usage by device and the time of the day.
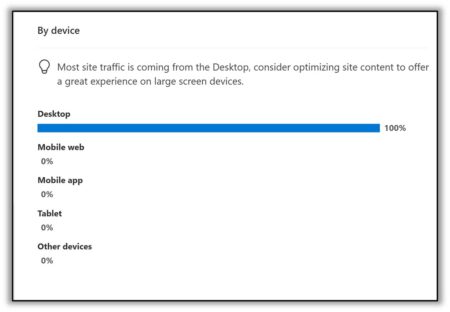
By Device
This dashboard shows the percentage of time spent on desktops, mobile web, mobile apps, tablets, and other devices over 7, 30, or 90 days.
Suppose you built the site for field use, but don't see any mobile usage. That might mean that users are forced to go into the office to access the site instead of remotely in the field where the work is being done. As a result, a different mobile approach might be warranted, such as using the OneDrive mobile app, Power Apps, or the Microsoft 365 Copilot mobile app.
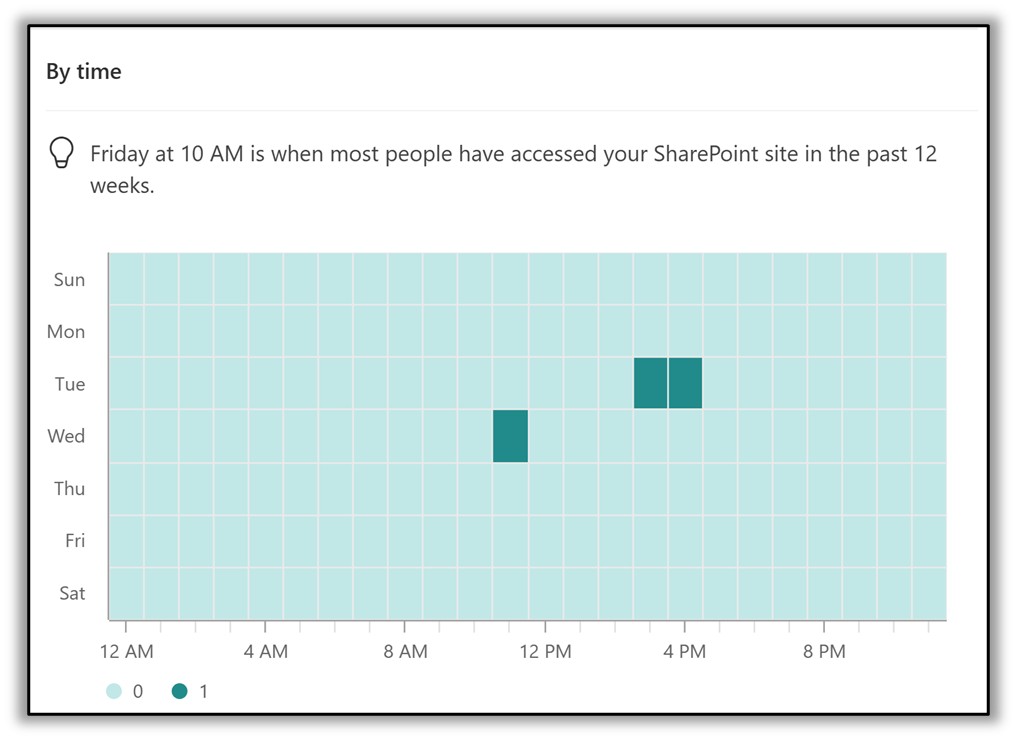
By Time
The by-time report shows the hourly trend of visits to the site over the last 7 days, 30 days, and 90 days for the viewer's local time zone. Darker shades on the chart refer to time slots when there are more views of the content on the site. This chart may be helpful if you want to target the ideal day and time for news or announcements to your teams.
Shared with External Users
This report provides a list of files you can access that have been shared outside your organization. The report is an Excel export that where you can choose where to save the file when you run the report. The report is handy if you want to monitor external sharing and analyze whether the approach to sharing is optimal, considering how the sites and libraries have been organized.
Final Thoughts
The SharePoint site usage reports are an excellent but often overlooked feature for gaining better insights into how your sites are being accessed and used. They provide a tool to support further investment in developing new site features or deleting a site to shrink the footprint and overall file storage.
If you are still brainstorming on how to structure your SharePoint sites to be the most effective for your project teams and have some questions, you can reach out for a free one-hour consultation here. We are always happy to help.
If you want a turnkey construction management solution for Microsoft 365, check out Construction Viz and request a demo here.


Related Posts
Struggling to Share SharePoint Files Externally? Here’s the Fix
How the New Copilot Project Manager AI Agent Benefits Construction Scheduling
Construction Document Management and the SharePoint Term Store