Dashboards made simple with SQL Server Mobile Report Publisher
Construction Viz and SQL Server Mobile Report Publisher from Microsoft let you build and easily share gorgeous custom project dashboards with your team.
If a picture is worth a thousand words, then a well-designed dashboard is worth ten thousand.
Dashboards and visual reports are essential for construction organizations managing multiple projects, letting stakeholders see project status and other critical data at a glance. And since your project team members are constantly on the go, they need to have access to these dashboards on their mobile devices.
Which is why we are thrilled to see Microsoft continue to enhance their SQL Server Mobile Report Publisher – and why we leverage its capabilities within Construction Viz.
SQL Server Mobile Report Publisher, introduced in 2016, builds on technology from Datazen Software, a mobile business intelligence and data visualization startup that Microsoft acquired in April 2015. We were already integrating Datazen’s technology into solutions for our clients, so Microsoft’s move made a lot of sense to us. We were eager to see Microsoft add Datazen’s offerings to the SQL reporting stack.
Fast forward to today and Microsoft just keeps making SQL Server Mobile Report Publisher better. The simple-to-use tool lets users build powerful and attractive dashboards in minutes. Users can then share and access the dashboards directly on a mobile device or embed them into a Construction Viz / SharePoint page like other SSRS reports.
Read on for a quick run through.
How to Create a Dashboard in SQL Server Mobile Report Publisher
Building a dashboard in SQL Server Mobile Report Publisher is very intuitive.
Step 1: Configure Your Data & Settings
SQL Server Mobile Report Publisher has a simple menu system of tabs on the top left of the tool (see image below).

Click through the Layout, Data and Settings tabs to configure your report.
Layout – Where you pick the components of your report, which can include:
• Navigators – Menu system
• Gauges – KPIs
• Charts – Standard charting tools
• Maps – Maps of continents, states, and custom maps
• Data Grids – Grids to filter data
Data – Where you add data from multiple sources to your report.
Settings – Basic report settings such as start and end date.
Step 2: Define Your Target Device
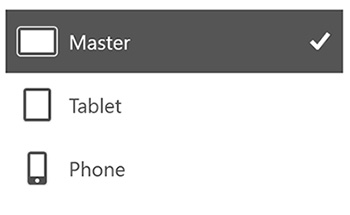
Click the dropdown on the top right to specify whether you are creating a master or a custom version for tablet or phone.
TIP: It is best to save layouts for each so that your dashboard looks good on all devices.

Step 3: Build Your Report
Drag the desired elements (navigators, gauges, charts, etc.) from the Layout tab onto the grid for your new mobile report. You can resize each element as necessary.
If any elements are missing information you need, you can go back to the Data tab to select other data sources. Update the Layout parts if needed.
Step 4: Preview the Report
Click on the Preview tab to see what your report will look like with actual data before you publish it.
Step 5: Publish the Report
That’s it – you finished building your custom report. You can now share or embed your report.
Mobile-first Construction Project Management with Construction Viz
Construction Viz, our turnkey construction project management solution powered by SharePoint 2016 and SQL, lets you stay productive in the office and at the job site.
We designed Construction Viz to offer a seamless mobile-first experience using our bootstrap front-end framework and offline support technologies. So you can use your preferred browser and device to access and update mobile forms and reports—even if you don’t have internet access.
Contact us for a free consultation to learn how you can combine the power of SQL Server Mobile Report Publisher and Construction Viz to provide stunning mobile dashboards for your team.

Related Posts
How the New Copilot Project Manager AI Agent Benefits Construction Scheduling
Construction Document Management and the SharePoint Term Store
Murph 2025 is almost here – Take the Challenge!