Tips from the Field: Adding Images to a Power BI Report
Microsoft 365 Power BI is an incredibly powerful reporting tool and is fast becoming the go-to reporting solution in construction. While creating connections to different data sources and building cool reports is relatively straightforward, adding dynamic images is not as simple.
Read on to learn how to add images to your Power BI report.
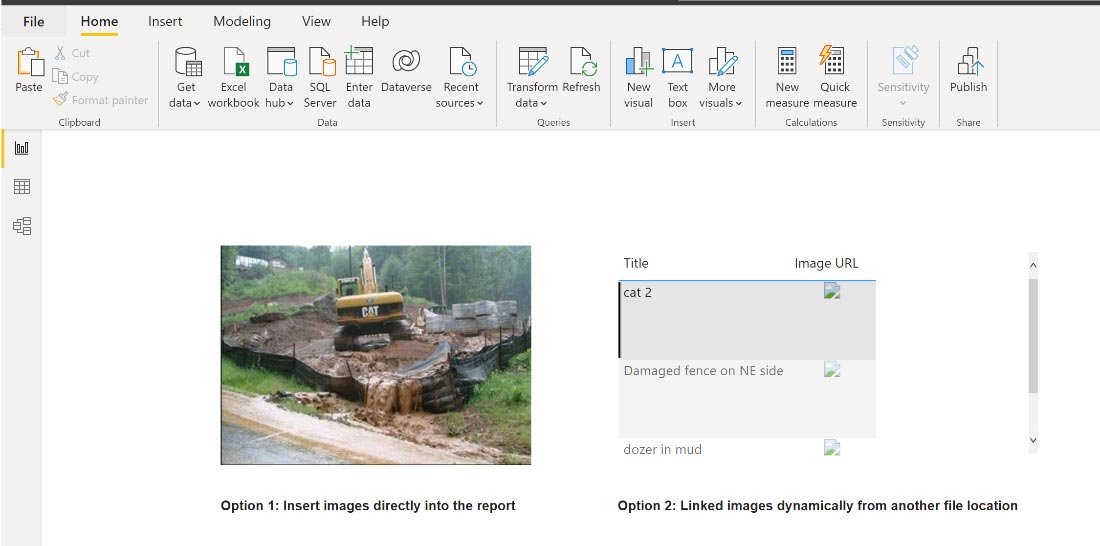
Two options when adding images to Power BI reports
There are two paths to adding images to a report.
Option 1
Your first option is to insert images directly into the report. This approach is useful if you want to embed a static image into your report, like adding a logo to a project-specific report.
Unfortunately, you need to open Power BI, update the report, and re-publish it to add or edit images.
Note: These embedded images will display when you print a report.
Option 2
Your second option is to link images dynamically from another file location. This approach allows you to connect to images from another file location and display them dynamically in your report.
A good example of this would be a set of project progress photos that are dropped off in a SharePoint image library every month. You could then connect these photos to your report and use a project and time period slicer to display only the images you would like to see in the report.
While this approach provides the most flexibility, since images are read from the image library, the setup in Power BI of the connection is more difficult.
Also, there are a few considerations to be aware of:
- Viewers must have permission for both the image library and the Power BI report to view the images.
- Images will not display in Power BI Desktop until you publish the report to Power BI Online.
- The connected images will not display when you print a report.
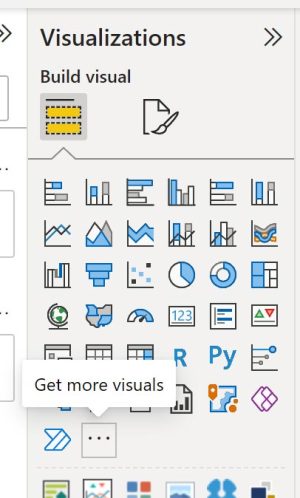
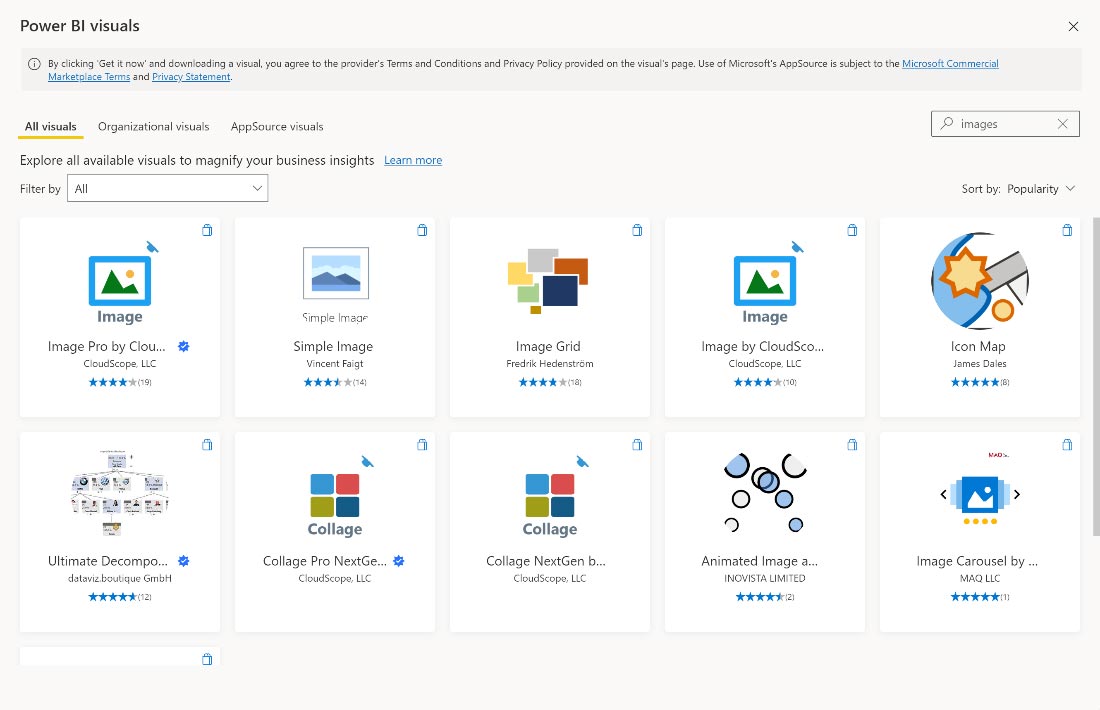
- When images initially display in Power BI, they will appear as small thumbnails, and you will not have many options to format them. You will most likely need to “Get more visuals” and find a third-party image display visual. See the screenshots below for how to do this.
Step 1: Click the three dots and select “Get more visuals”
So, you might wonder how actually to create a dynamic image connection in your report from SharePoint? There are a bunch of steps to doing this, but I found a great video to get you most of the way there: A little trick for SharePoint Online Images in Power BI.
We hope this blog helps you build out your project status report. If you need a complete reporting solution from building a Power App to collect period data or structuring a Power BI Report that can filter by project and period, you can submit a consultation request here.


Related Posts
How the New Copilot Project Manager AI Agent Benefits Construction Scheduling
Construction Document Management and the SharePoint Term Store
Murph 2025 is almost here – Take the Challenge!