
Easily Integrate Geospatial Maps and Project Data with Construction Viz
“Dude, where’s my project?” is not something project teams should ever need to wonder. Integrating geospatial information into your PMIS solution enables you to combine project data with map data. For projects spanning multiple locations, this kind of insight is invaluable to project teams in your organization.
Geospatial mapping software, such as ArcGIS, provide interactive ways to display project information in the context of a map. Seeing information geospatially is extremely helpful to project teams working on geographically dispersed engineering or construction projects. For example, oil and gas transmission and distribution projects.
Programs like ArcGIS enable the creation and consumption of geospatial maps. But project teams typically need these maps to also show content that isn’t available in ArcGIS such as documents, forms, videos, images, dashboards, and reports. The challenge is finding a way to update these content types geospatially, with all the great features ArcGIS provides, in a fully mobile UI.
Typical Methods of Displaying Geospatial Data for Construction Projects
We have implemented many solutions over the years for displaying geospatial data as part of SharePoint deployments for our clients. Each of the typical methods for adding map data to SharePoint has a niche application. But each came with one or more drawbacks:
Inline Frames – An Inline Frame (I Frame) is an HTML document or page embedded inside SharePoint. The I Frame is linked to web pages with custom JavaScript. While this approach works for any external content that you want to display inside SharePoint, the user experience is lacking. Maps displayed this way are also not responsive for mobile devices.
Third-Party Apps – There are some slick and affordable apps available for displaying mapping data and even incorporating SharePoint content into the maps. However, their flexibility and functionality are often limited. For example, they are typically unable to connect to more than [SW1] [JL2] one SharePoint list and are not responsive for mobile devices. It is also a gamble to use them since many of these apps are rarely updated with enhancements and are not customizable.
Vendor Supported Apps – Since SharePoint is the #1 Enterprise Content Management System (ECM), many geospatial software vendors provide their own SharePoint apps. These apps are great in that they can connect directly to the vendor’s software and allow for some SharePoint connections. But again, they are limited in functionality, cannot be enhanced, and are not responsive for mobile devices.
The above methods worked well enough to serve limited requirements, but the shortcomings left us wanting a better solution.
Which is why we decided to build a custom mapping solution for Construction Viz, our subscription-based construction project management platform.
 The Construction Viz Mapping Solution
We designed Construction Viz to provide tight integration between project data and geospatial information. We wanted our mapping toolset to be robust, flexible and responsive.
The Construction Viz mapping solution offers the following key benefits:
Robust Interconnectivity – The Construction Viz mapping solution connects to essential project information sources, including:
- SharePoint – E.g. lists, form libraries, document libraries, image libraries, video libraries, etc.
- SQL – Bi-directional data transfer between SharePoint and SQL allows data to be sent back to the SQL data warehouse from the map itself and updated from SQL directly (or staged via a SharePoint List).
- ArcGIS – Direct connectivity with Esri’s ArcGIS Online enables live updates to layers and other content. Additionally, KML layers can be uploaded to a document library and displayed on maps via layers.
Flexible functionality and extensibility – The ability to change map behavior depending on project need is a critical business requirement. Our mapping tool utilizes a JavaScript framework that we have incorporated across our Construction Viz and SQL solutions. This framework ensures a consistent user experience across our SharePoint pages and web parts as well as SQL-based solutions. Our primary goal was to anticipate how construction project teams would use the map data and provide this functionality in an easy to use and intuitive layout.
Responsive, mobile friendly design – Since Construction Viz is a mobile solution, we needed to make sure our mapping tools could be accessed on a mobile device with the same experience as being on a desktop. We built the solution to work on IOS, Android, and Windows mobile devices.
Other features of the Construction Viz mapping solution include:
- Custom filters (such as program and project) for querying large data sets
- Clustering of large data sets
- Custom layer queries (such as Over Budget, Behind Schedule, etc.)
- KML layers
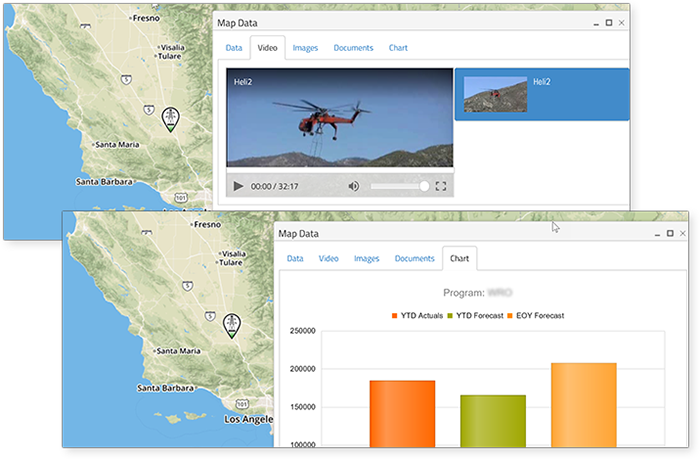
- Pop up/click event windows for displaying data related to locations such as:
- SQL Data for financial and schedule information
- Video and images stored in image libraries
- Documents stored in document libraries
- Charts/Dashboards of project progress
- Printing
Want Geospatial Map Data Integrated with Your Team’s Project Data?
Find out more about Construction Viz by visiting our microsite, or contact us to schedule a free consultation and demo.
Related Posts
Struggling to Share SharePoint Files Externally? Here’s the Fix
How the New Copilot Project Manager AI Agent Benefits Construction Scheduling
Construction Document Management and the SharePoint Term Store