• Skip to primary navigation
  • Skip to main content
  • Skip to primary sidebar
  • Skip to footer
Lydon Solutions

Lydon Solutions

Construction Project Management Software Solutions

  • Construction Viz
  • Clover AI
  • Services
    • Business Consulting
    • Professional Services
    • Microsoft 365 Managed Services
    • Government Agencies
  • Company
  • Events
  • Blog
  • Careers
  • Contact
  • Search
  • Free Consultation
Show Search
Hide Search

SSRS 2016

Dashboards made simple with SQL Server Mobile Report Publisher

How-To | December 5, 2017

Construction Viz and SQL Server Mobile Report Publisher from Microsoft let you build and easily share gorgeous custom project dashboards with your team.

If a picture is worth a thousand words, then a well-designed dashboard is worth ten thousand.

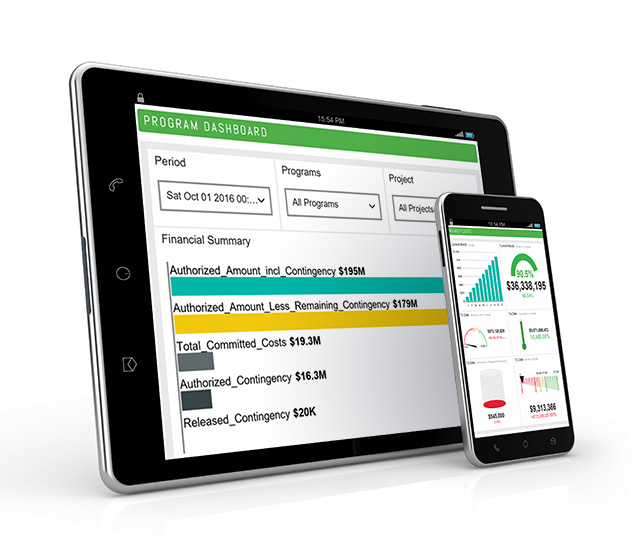
Dashboards and visual reports are essential for construction organizations managing multiple projects, letting stakeholders see project status and other critical data at a glance. And since your project team members are constantly on the go, they need to have access to these dashboards on their mobile devices.

Which is why we are thrilled to see Microsoft continue to enhance their SQL Server Mobile Report Publisher – and why we leverage its capabilities within Construction Viz.

SQL Server Mobile Report Publisher, introduced in 2016, builds on technology from Datazen Software, a mobile business intelligence and data visualization startup that Microsoft acquired in April 2015. We were already integrating Datazen’s technology into solutions for our clients, so Microsoft’s move made a lot of sense to us. We were eager to see Microsoft add Datazen’s offerings to the SQL reporting stack.

Fast forward to today and Microsoft just keeps making SQL Server Mobile Report Publisher better. The simple-to-use tool lets users build powerful and attractive dashboards in minutes. Users can then share and access the dashboards directly on a mobile device or embed them into a Construction Viz / SharePoint page like other SSRS reports.

Read on for a quick run through.

How to Create a Dashboard in SQL Server Mobile Report Publisher

Building a dashboard in SQL Server Mobile Report Publisher is very intuitive.

Step 1: Configure Your Data & Settings

SQL Server Mobile Report Publisher has a simple menu system of tabs on the top left of the tool (see image below).

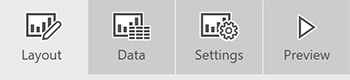
Click through the Layout, Data and Settings tabs to configure your report.

Layout – Where you pick the components of your report, which can include:
•      Navigators – Menu system
•      Gauges – KPIs
•      Charts – Standard charting tools
•      Maps – Maps of continents, states, and custom maps
•      Data Grids – Grids to filter data

Data – Where you add data from multiple sources to your report.

Settings – Basic report settings such as start and end date.

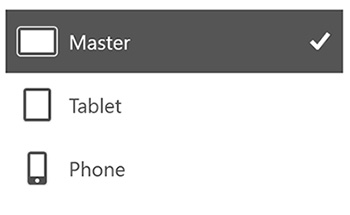
Step 2: Define Your Target Device

Click the dropdown on the top right to specify whether you are creating a master or a custom version for tablet or phone.

TIP: It is best to save layouts for each so that your dashboard looks good on all devices.

Step 3: Build Your Report

Drag the desired elements (navigators, gauges, charts, etc.) from the Layout tab onto the grid for your new mobile report. You can resize each element as necessary.

If any elements are missing information you need, you can go back to the Data tab to select other data sources. Update the Layout parts if needed.


Step 4: Preview the Report

Click on the Preview tab to see what your report will look like with actual data before you publish it.

Step 5: Publish the Report

That’s it – you finished building your custom report. You can now share or embed your report.

Mobile-first Construction Project Management with Construction Viz

Construction Viz, our turnkey construction project management solution powered by SharePoint 2016 and SQL, lets you stay productive in the office and at the job site.

We designed Construction Viz to offer a seamless mobile-first experience using our bootstrap front-end framework and offline support technologies. So you can use your preferred browser and device to access and update mobile forms and reports—even if you don’t have internet access.

Contact us for a free consultation to learn how you can combine the power of SQL Server Mobile Report Publisher and Construction Viz to provide stunning mobile dashboards for your team.

Construction Reporting Made Simple with Construction Viz and SSRS 2016

How-To | January 31, 2017

Microsoft significantly enhanced their lineup of reporting tools with SQL 2016 and SSRS. Construction Viz puts these powerful visualization and mobile capabilities at your fingertips

We wrote about the robust mobile and offline reporting capabilities enabled by Datazen in a previous blog post back in December 2015.

We are always on the lookout for smart solutions to construction program management challenges. Datazen’s powerful mobile reports impressed us right away. Our team used Datazen and SQL to build real-time mobile dashboards and KPIs that construction teams could access no matter what OS or device they used. Datazen also enabled us to create offline reporting solutions for use in the field.

Datazen was powerful, but at the time it was still a separate application that resided on top of SQL. Taking advantage of it required custom integration.

Microsoft changed that by acquiring Datazen and incorporating their mobile capabilities into SQL 2016. Datazen is now a core part of the SQL Server Reporting Services (SSRS) toolkit. We think this is great news for our clients in the construction industry. Read on to learn why.

Construction Viz Takes SQL 2016 and SSRS to the Next Level

Construction Viz, our subscription-based construction project management solution, is powered by Microsoft SharePoint 2016, SQL 2016 and Azure. That means Construction Viz puts the power of SSRS – including the mobile capabilities of SSRS Mobile (Datazen) – at your fingertips, on any device.

Here are just a few of the powerful reporting features that Construction Viz enables for each business need:

SSRS Mobile Reports (formerly Datazen) – Construction Viz leverages the latest SSRS features to provide reports optimized for mobile viewing. Users can get business insights on the go from any device.  These reports are ideal for dashboards and KPIs for the manager or executive on the go to access through a Construction Viz site or SSRS Mobile.

SSRS Paginated Reports –  Paginated reports are the cornerstone of complex reporting in both SharePoint and SQL. These reports are great for printing and bringing into construction review meetings, such as monthly reports, status reports, and form logs. Construction Viz makes it simple to create and customize paginated reports that are attractive, clean and modern looking. Need to add data from a report to a presentation? No problem. Export a live and editable report from Construction Viz to PowerPoint. And, if you already have reports that you’ve created on-premises in SSRS, it is easy to pin any Construction Viz report to your Power BI dashboards to monitor all your reports in one place.

Custom KPIs, Dashboards, and Interactive Grid View widgets – Our custom JavaScript widgets make it possible to aggregate and report on data – both from within Construction Viz and combined with external sources.  Responsive dynamic progress metrics right on a web page are ideal for quick statuses of project progress and interactive data grids provide for grouping, sorting, filtering, and exporting data in an easy-to-use format.

Geospatial Mapping – Location matters for construction projects. Our custom mapping solution enables the integrated display of data from external sources like ARC GIS combined with documents, images, video, and dashboards. This combined information can be displayed geospatially in popup windows or layers.  Stay tuned for follow up blog post on Mapping.

Analytical reports and charts created with Excel – Excel is the most widely used analytical tool today – and will likely continue to be for a long time. Construction Viz integrates seamlessly with Excel, thanks to its underlying SharePoint framework. These types of reports are ideal for project teams to quickly post up existing Excel files.  Simple, easy to use, and already available.

It is exciting to see all the rich new reporting functionality Microsoft baked into SSRS and SQL 2016. Even more exciting is all the new possibilities these capabilities enable for our clients.

Ready to Perfect Your Project Management with Construction Viz?

Find out more about Construction Viz by visiting our microsite for this new offering, or contact us to schedule a free consultation and demo.

Primary Sidebar

Recent Posts

Microsoft Tips | May 1, 2025

Use Microsoft 365 Groups for a Project Email Inbox

AI Solutions | April 24, 2025

Copilot and Planner Premium – R.I.P. Project Schedulers?

SharePoint Favorites
Microsoft Tips | April 16, 2025

Always Find What You Need With SharePoint Favorites

sharepoint site usage analytics
Microsoft Tips | April 10, 2025

You Built It. Now Make Sure They Come: SharePoint Site Usage Analytics

Microsoft News | April 1, 2025

Running Out of Storage? Check Out the New Microsoft 365 Archive Feature

Microsoft Tips | March 24, 2025

How to Manage Construction Project Photos in SharePoint

Footer

About

Lydon Solutions is a WBE consulting group specializing in construction project management software solutions using Microsoft SharePoint. Learn more >

Products & Services

  • Construction Viz
  • Clover AI
  • Professional Services
  • Business Consulting
  • Microsoft 365 Managed Services
  • Government Agencies

News & Events

  • Events
  • Blog

Company

  • About
  • Careers
  • Contact Us

Join our Mailing List

  • This field is for validation purposes and should be left unchanged.
Lydon Solutions

© Lydon Solutions

  • Sitemap
  • Privacy
  • Cookies
  • Terms of Use
  • Disclaimer

Click here to start a Microsoft Teams chat.

Contact Us
Name(Required)
This field is for validation purposes and should be left unchanged.